
No, this isn’t a special holiday cooking edition of the LeanBP Blog! To celebrate the season, I thought I’d share with you the formula for applying lean to business processes successfully—the method at the heart of my week-long LABP course.
Always Start with Focus
There’s no bigger problem in process improvement than starting without a strategy. Lack of organizational focus is the number-one challenge for businesses, government entities, and nonprofits alike—to say nothing of your own personal and professional growth. I’ve named it the eighth waste in lean; the truth is, it’s the root cause of the other seven traditional wastes.
If you’re familiar with Eliyahu Goldratt’s Theory of Constraints, you know it’s designed to answer three questions:
- What to change
- What to change it to
- How to cause the change
The first question is directly about focus. Organizations should first go about finding the root cause of their revenue (or mission) constraints. Leaders should see this as their primary obligation—and should be happy to find that root cause so that improvement can begin. I created this strategic alignment and deployment (SA&D) guide to offer leaders a standard, visual, and repeatable methodology for that process.
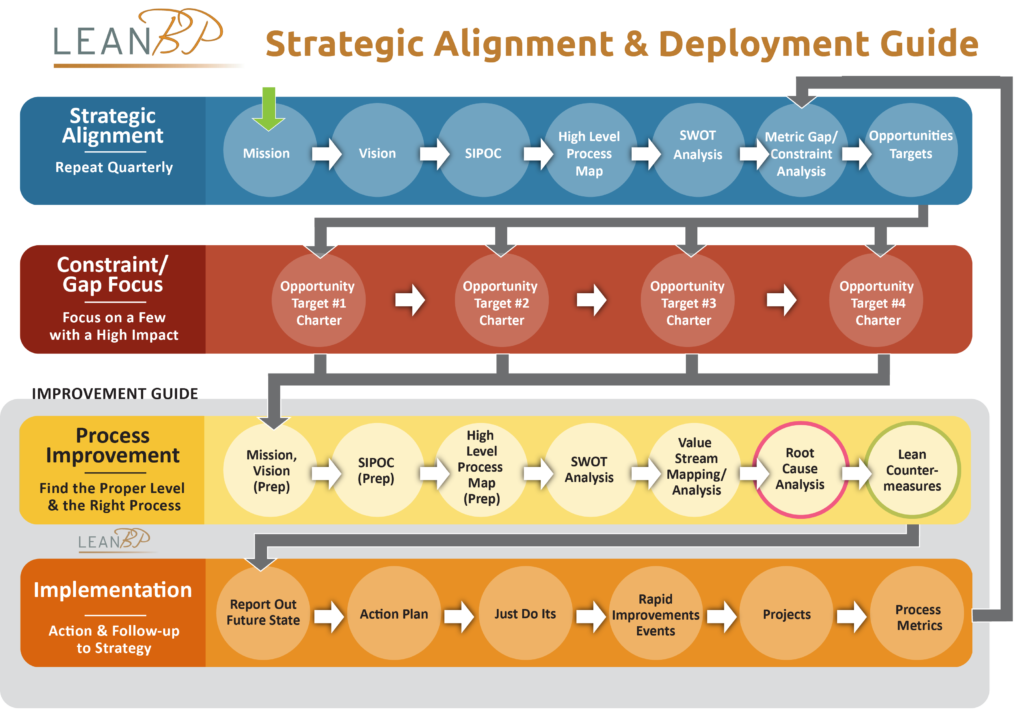
The SA&D guide is my secret sauce for success. My experience working with hundreds of students and clients over the years is that we all have difficulty seeing abstract concepts from our own perspectives, and understanding our place in the system. That’s why I created the SA&D guide—to help you see your own role more clearly, apply lean one step at a time, and stay focused on your goal.
By following the blue line in the guide, you can easily discover and communicate the path to your constraint at any level. Without articulating and making those items visual, problems become moving targets camouflaged with hidden agendas that dilute improvement efforts. In LABP, I have participants fill out a template for each segment of the blue line.
Click to download the PowerPoint template.
Slide 1: Mission and Vision
Create a simple statement defining your organization’s unique mission at the level of your responsibility, whether you’re a CEO, CFO, VP, department head, or individual contributor. Consider your leadership’s directives and your customers’ needs as inputs (indicated by the green arrow).
Do:
- Define your core purpose objectively.
- Include a balancing metric, as indicated by the word “while”; for example, increased production (core purpose) while adhering to safety standards (balancing metric).
- State your mission in the following simple format:
[Name of organization or job title] + [verb] in order to [do what?] for [whom?] while [balancing metric].
Example:
Bill Peterson advances the application of lean to business processes in order to increase competitiveness for clients in diverse industries while building revenue and reputation.
Don’t:
- Get ahead of yourself and outline the solution. Simply state the mission. The goal is to see the process and discover the fix through a new lens.
On the bottom half of the slide, articulate your vision for the future. This is a very powerful tool—and it’s even more powerful if you can get others to see that vision and accept it. If you don’t describe the results you want to see, how will you know when you get there?
Do articulate a quantifiable vision by a set date (within a year).
Don’t set a date farther out without a one-year view. Where is the sense of urgency with a five-year vision? It’s fine to have goals that will take longer to achieve, but you should know where you want to be in a year.
Slide 2: SIPOC (Suppliers, Inputs, Policies, Outputs, and Customers)
This step involves creating a five-column table of your responsibilities, which gives you excellent situational awareness at a glance. Remember: you go from right to left in this exercise.
- Customers: Include the customer you named in your mission statement, and then list all other customers, including internal customers. That means everyone for whom you provide outputs. On my own SIPOC, I even include finance as the customer of my expense statements.
- Outputs: It may be time-consuming, but you need to list everything you provide those customers—documents, oversight, reports, services. If you can’t describe it, how can you convince customers your output is valuable to them, you, or your organization?
- Policies: Make a list of your organization’s policies (regulatory, organizational, formal, and informal).
- Inputs: Start with whatever triggers you to provide your outputs, and then list all the inputs you need to create your outputs.
- Suppliers: Internal and external sources who provide inputs to you.
This exercise shows all your interconnections—it’s like a schematic to understand and troubleshoot your process. You may find, as many of my students do, that your customer is also your supplier.
Slide 3: High-Level Process Map
Completing a high-level process map allows you to see your process through the lens of different lean metrics.
Try to consider your process as a series of gates or buckets, much like the picture of the blue line, and limit the total number of buckets to 6–8. This may be difficult, because it’s hard to see your own process. Have you ever been on your phone map app and it showed you your destination, but you couldn’t tell how to get there until you zoomed out? This is what you need to do for your process to see it, to share it, and learn from it.
Sometimes, you’re responsible for two or three totally disparate processes. If that’s the case, it’s best to do a map for all of them, but try to stay high-level.
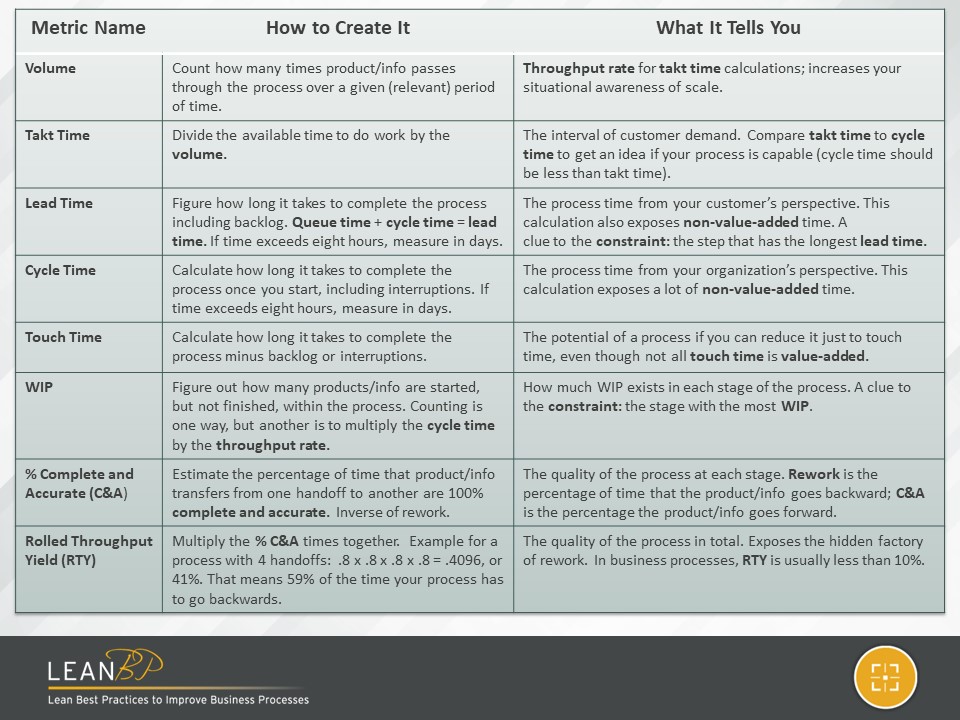
Then consider these lean metrics:
- Volume. How many and over what period of time?
- Takt time. What’s the available time divided by demand?
- Lead time. How long does it take to get through the system from the time request (including the queue)?
- Cycle time. How long does it take to get through the system once started (minus the queue)?
- WIP. How many are in the system now?
- Rework. What percentage of the time does the process go back a step?
- Constraint. Where’s the kink in the hose? (Your clue: it’s usually the bucket with the longest lead time or the most WIP.)
These are not the typical cost accounting metrics you have readily available, but go ahead and make some estimates now, and confirm or measure later. Here’s a handy chart for your reference:
Slide 4: SWOT Analysis (Strengths, Weaknesses, Opportunities and Threats)
Filling out this chart provides you situational awareness of intangibles. The upper two quadrants are for strengths and weaknesses internal to your organization. Work those first. The bottom two quadrants are for external opportunities and threats.
I consider this a map of the minefield where you’re operating, pinpointing the location of safe places and danger zones. For every weakness or threat, there’s a potential mitigating course of action you should be considering.
Slide 5: Analysis
The last slide of the template asks you: what did you learn from this? What’s your biggest issue, and can you put it in a problem statement to focus on? You’re trying to identify the targets that you’ll break out into more detail in the red line of the SA&D guide.
I urge you to try this out—there’s nothing to be afraid of! The act of putting your process to paper will automatically generate ideas and solutions. Right now, all you’re likely to have is your organizational chart and your current cost accounting metrics. (And how’s that working out for you?)
Simply following this methodology at every level of the organization—while considering input from the higher level—eliminates much internal competition and misunderstanding. The process will show the path to the constraint and should continue at each level until the origin is found. What could be more important than that?
Putting your process on paper ensures you’ll always be working on the most important improvement.
Share your results first with your direct supervisor for input and validation. Then, share with your direct reports, so they understand your vision. This creates alignment so that everyone is pulling in the same direction. You can even use this document as the basis of your performance evaluation and to set next year’s goals.
Not only does this methodology keep the focus on the most important improvement at hand, but if it’s completed quarterly, your strategy will also be constantly updated. What strategy ever survived an entire year unchanged? How motivated would you be if you knew you were working on the most important task at all times?
In all my years of facilitation, lack of organizational focus has consistently been the largest constraint to process improvement and personal growth. Completing the blue line of the SA&D guide reveals TOC’s “what to change”—the place your focus should be as issues swirl around you and people pull in different directions. This straightforward and meaningful exercise has unleashed the personal and organizational success of many a client.
Coming up on the blog, we’ll tour the yellow and orange lines—what to change to and how—but by starting with the blue line, you’ll have jumped your first hurdle and overcome the first constraint.
Want to start your year the right way, with better situational awareness and your eyes on the prize? Work this blue line and then attend my next Lean Applied to Business Processes program Feb. 10–14 at the University of Tennessee Haslam College of Business. Registration is open now! I hope to see you there.
Thank you, Bill! This provides a lot of clarity.
Comments are closed.